An agent investigates. An SRE decides.

The evidence bench: inspect the observations before deciding what to change. Conceptual anime illustration; the product screenshots and packet measurements below are the actual evidence.
I am an SRE. The part of AI troubleshooting that interests me is the investigation: reading logs, checking a dependency, testing an explanation and finding a useful next question. The part that makes me cautious is the jump from a plausible explanation to a change in a system the model only partly understands.
An agent might see a timeout without knowing the service contract, the dependencies behind it or the business impact of allowing requests to wait longer. It can suggest a technically plausible fix while missing the reason that configuration exists. In my own use, agents can be good at diagnostics and still propose conflicting or disruptive corrective actions.
I built Rootweaver Resolve to explore a more useful handover. Give a model access to bounded debugging checks. Let it gather observations and revise competing explanations. Then show an experienced person what it checked, what came back, why the assessment changed and what is still missing. That person can decide whether the explanation holds and what action is appropriate.
This follows the approach I took in Memory as a Measurable Engineering Problem: start with a concrete engineering problem, retain the evidence and explain the limits alongside the result. Resolve is my project for the Nebius × NVIDIA Global AI Hackathon. This article follows one retained laboratory investigation, including a useful model contribution and two claims I would not accept at face value.
Watch the investigation
Download the test build · Read the source and experiments · Watch on YouTube · Read the captions · Project write-up
Green readiness, failing requests
The investigation starts with an awkward but familiar situation: the dependency appears ready, while the client records timeouts. That leaves several plausible places to look. Is the Service selecting the intended endpoint? Is traffic reaching it? Is the server answering too slowly? Is the client giving up before the service is expected to respond?
The model used was NVIDIA Nemotron 3 Ultra, called through Nebius Token Factory, as recorded in the retained model request. In this run, it selected four checks from an approved catalogue across five inference calls. Rootweaver Observe supervised collection. The host fixed the scope and executed the checks. The last call produced the handover after the catalogue was exhausted.
| Recorded check | What actually ran | What it could contribute |
|---|---|---|
| Client logs | A fixed kubectl logs read, limited to 100 lines and five minutes | The client’s reported failures, within that log window |
| Service and EndpointSlice | A fixed kubectl get with the experiment label selector | Addresses, ports and endpoint-selection evidence |
| TCP capture | Observe’s node runner, dumpcap, then offline TShark decoding | Whether the selected path exchanged packets and how long the observed exchanges took |
| Pod status | A fixed kubectl get pods read | Workload status in the captured snapshot |
The exact command equivalents, acquisition times and scopes are retained in the method record. Kubernetes EndpointSlices describe backend endpoints and their conditions. They are useful evidence about selection, but they do not tell me whether a particular application operation finishes within its intended budget.
The packet check went beyond interpreting an HTTP status code. It examined transport events and their timing. It was still deliberately bounded: a ten-second capture, a packet cap, file limits, resource limits and a target pinned to the lab client and dependency. The method record includes those limits. They constrain one collection path; they do not qualify the system for arbitrary production use.
The model chooses a check; the host owns execution
The practical distinction is visible in the retained controller. The model returns a check identifier from the currently available catalogue. It does not provide a shell command for the host to execute.
check = value["next_check"]
if check is not None and (
    not isinstance(check, str)
    or check not in {c["id"] for c in view["available_checks"]}
):
    raise ValueError("check_not_available")
Explain this code line by line
- Read the proposed next check from the model’s structured response.
- Permit
Noneas a request to stop choosing checks. Otherwise, validate the choice. - Reject a value that is not a string identifier.
- Reject a string that is not in the checks available for this step.
- Finish the combined rejection condition.
- Raise an error instead of accepting an unavailable check.
For example, a proposal selecting the available packets check can reach the host’s fixed capture implementation. A string containing an arbitrary command is not an available check ID and fails this validation. That is a small, inspectable boundary. Other validation checks the response shape, hypothesis identities and evidence references. None of those checks proves that the model’s explanation is true.
Open the investigation and authority flow
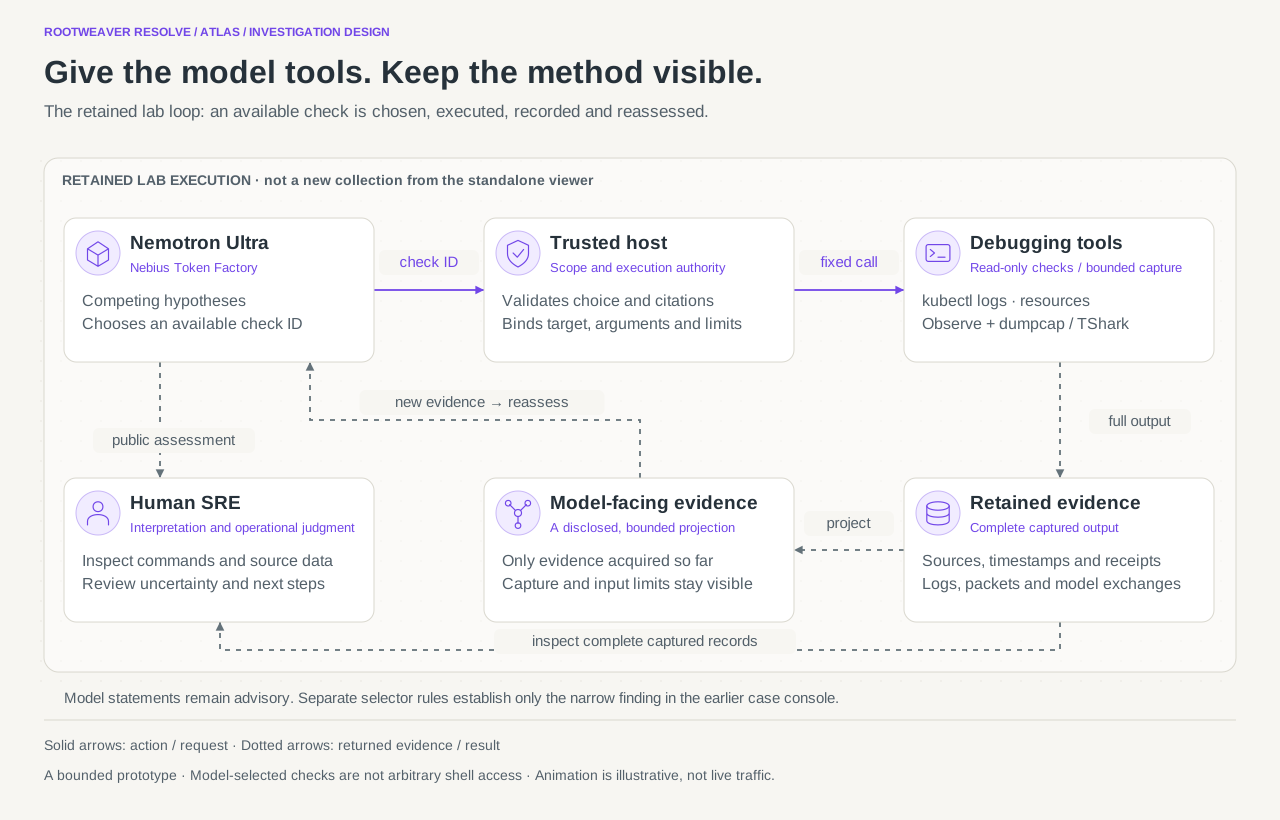
Existing Resolve architecture artwork, intentionally reused in its product palette. Dots show the direction of information, never live execution. The static view is the default; reduced-motion settings disable playback. Editable diagram source.
Rootweaver Observe is useful here because it supplies additional observations when the model does not know enough. It does not manufacture knowledge of the complete architecture. This demonstration exercised Kubernetes reads and a packet capture. It does not establish that every tool available elsewhere in Observe, including other network or kernel debugging tools, participated in this run.
What the packets actually establish
The retained capture contains 45 frames across six TCP streams. Four streams contain the complete timing pairs used below. One starts after the request and handshake; another ends before server data appears. Counting those incomplete streams as complete observations would exaggerate the evidence.
The timings are measured from the first client payload to the first client FIN and the first server data in each complete stream. FIN is a transport observation. It is not a direct reading of the application’s configured timeout.
| TCP stream | Client FIN after payload | First server data after payload |
|---|---|---|
| 0 | 800.939 ms | 2,000.896 ms |
| 2 | 801.052 ms | 2,001.403 ms |
| 3 | 801.037 ms | 2,001.033 ms |
| 4 | 800.815 ms | 2,000.928 ms |
These are derived from the original PCAP by the repository’s offline timing script, rather than copied from the model’s prose. The observed exchanges weaken a simple explanation that this traffic cannot reach the selected dependency. They focus the next investigation on the wait before server data and the client’s waiting budget.
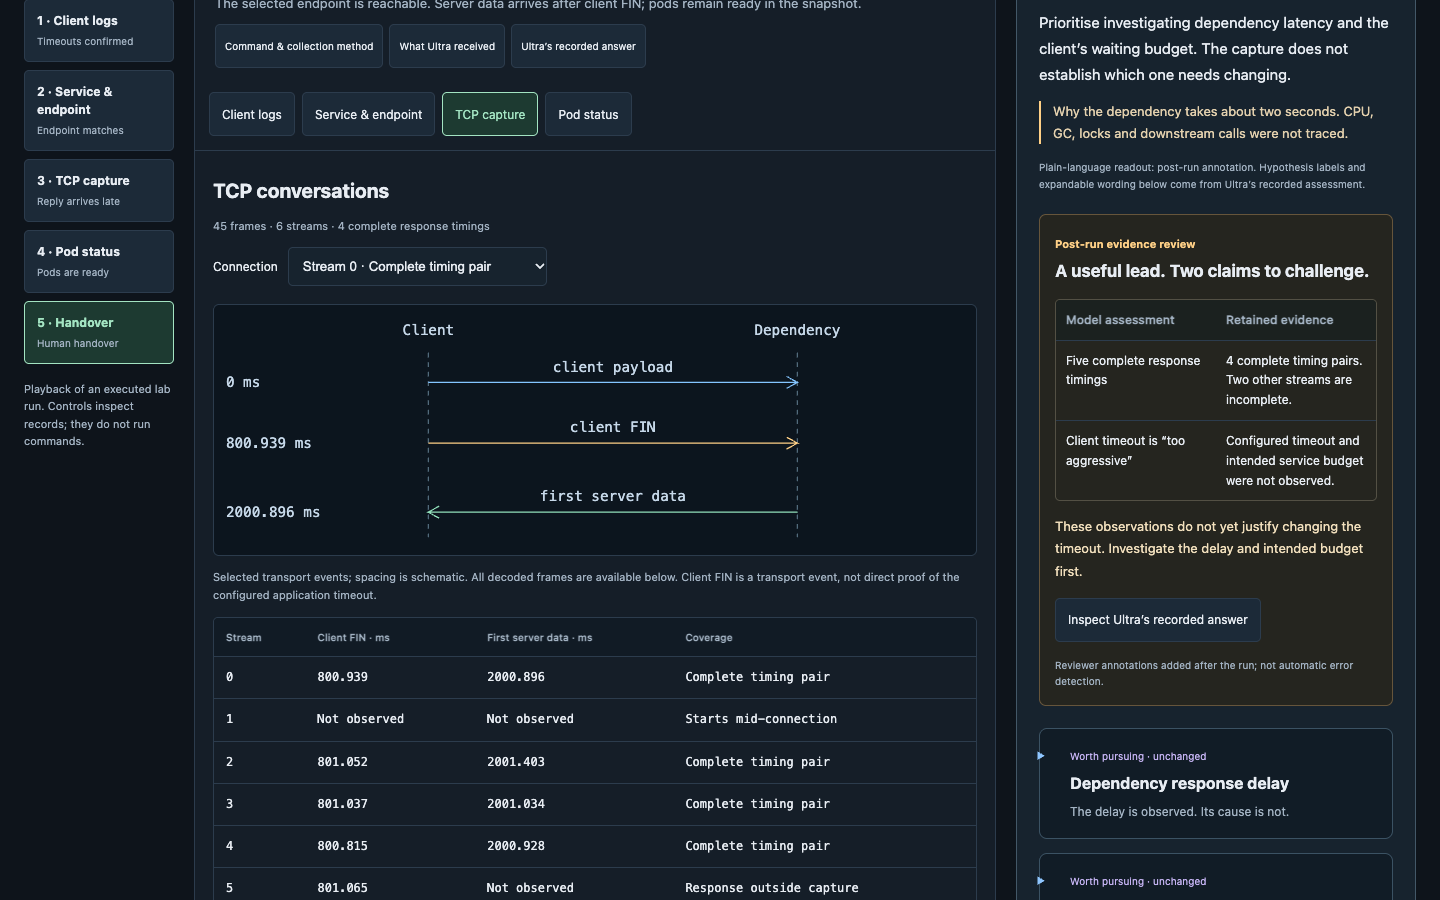
Actual product screenshot. The original model wording remains available beside the later evidence qualification. Open the image at full size to inspect the workbench text.
That is a useful narrowing of the search. It does not locate a server-side lock, a garbage-collection pause, CPU pressure or a slow downstream call. There is no process trace here establishing any of those causes. The earlier log window and later packet window are also not correlated request by request.
This is where I want a human handover to be precise: inspect the configured timeout and its intended service budget, then choose an appropriately scoped server-side observation to locate the wait. That follow-up has not run in this demonstration.
A useful model answer can still overreach
Ultra made two claims in its final retained answer that needed qualification. It described consistent server response timing across five streams, where the capture supports four complete pairs. It also called the client timeout too aggressive without having inspected its configuration or the service’s expected response budget.
The second error matters more operationally. Increasing a timeout might let a request finish in this fixture. That alone would not tell me whether the longer wait is acceptable, whether the dependency has regressed or whether the change would increase pressure elsewhere. The missing context is part of the decision, not a minor caveat after it.
The original answer also admits that the latency cause and configured timeout are unknown. Keeping both the useful reasoning and the overreach is more informative than replacing the response with an edited success story. The workbench’s qualifications were added during review after the run. The agent did not automatically detect or correct these mistakes.
The earlier case console contains a separate, narrow deterministic check for Service selection. That mechanism should not be confused with a general verifier for the packet investigation or every model statement. Valid JSON, a real citation and a plausible explanation are three different properties.
An SRE should be able to repeat the analysis
The repository retains the original lab PCAP, all 74 captured log lines, the method record, five original requests and the corresponding public model answers. The viewer uses a disclosed derivative with aliases; the research archive preserves the original disposable lab identifiers. Provider-internal reasoning was not retained under the original capture policy.
With Wireshark’s TShark installed, these commands inspect the capture locally from the repository root. They need no cluster connection or new inference call.
tshark -r research/packet-lab/capture.pcapng -q -z conv,tcp
python scripts/inspect_packet_timing.py
Explain this code line by line
-rreads the retained capture file.-qsuppresses the ordinary packet list, and-z conv,tcpprints TCP conversation statistics. This is an offline overview, not a new capture.- The repository script checks the expected capture digest, asks TShark for packet fields and calculates the timing pairs. It reports incomplete streams separately, so they do not silently become complete measurements.
I can reproduce that calculation on the same bytes. Rerunning a recorded kubectl command against a cluster later is different: it produces a new observation at a new time. Resolve needs to expose both the method and the evidence window so those two meanings of reproducibility do not get mixed together. A digest establishes that the retained bytes match; it does not establish that acquisition was complete or that a diagnosis is correct.
The interface had to become an investigation
The first visual workspace had a graph and plenty of evidence, but I was still struggling to know where to start. A sequence of tool names, JSON payloads and assessment text was not enough. As an operator, I wanted to see what had been established and why I should care about the next check.
The current workbench leads with the finding and a packet timing view. Readable tool output sits alongside the model assessment. A comparison makes the difference between an original claim and a reviewer qualification visible. The graph remains useful context, while exact output, source pointers, model inputs and forensic records stay available behind deliberate expansion.
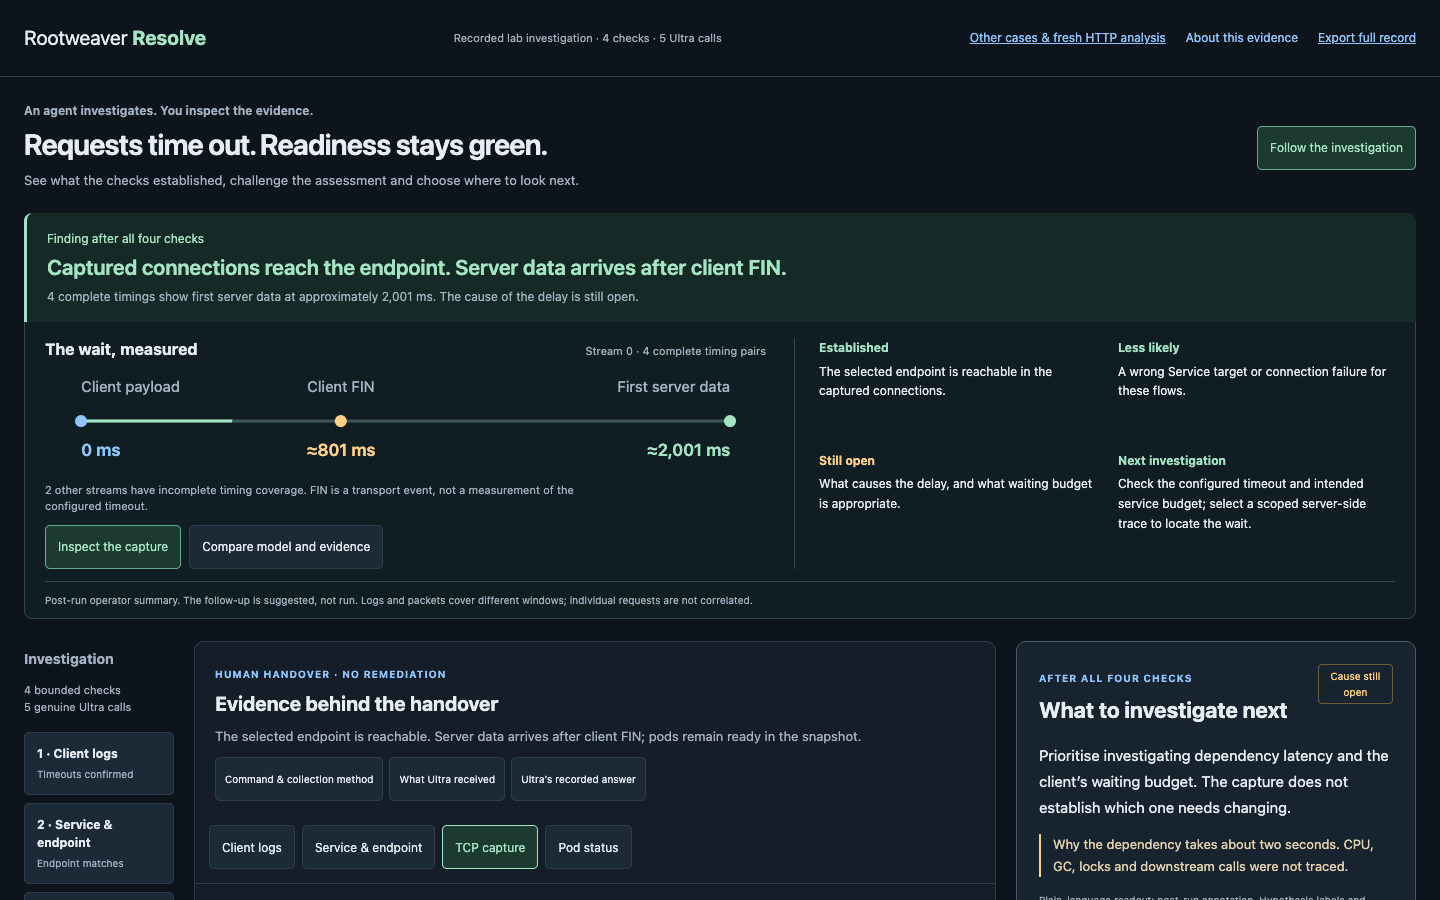
Actual desktop workspace. Progressive disclosure changes the reading order; it does not remove the complete captured evidence or original model responses.
That change is central to the product. I should be able to read a log or a TCP conversation as an SRE, then open the structured payload when I need to audit it. The model’s public rationale is an explanation to inspect, not a window into private internal reasoning and not proof of causal correctness.
What runs today, and what remains to be built
| Part | Current scope |
|---|---|
| Standalone workbench | Installs without private Rootweaver services and replays retained genuine observations and analyses. It does not execute the recorded cluster commands. |
| Opt-in fresh analysis | A separate route can send a fixed sanitised HTTP case to Ultra with the operator’s own provider key. It does not collect fresh cluster evidence. |
| Original investigation collector | Retained source documents the approved lab execution. It is not bundled as a general plug-and-play cluster backend. |
| Architecture, code and business context | A direction for further work, not an integration delivered by this release. |
The main investigation is one adapted lab fixture, four checks and five genuine calls. Four earlier fault-case records contain seven separate historical calls. Those are small, differently scoped experiments with different prompts and evidence windows. They are not a combined accuracy benchmark, a held-out evaluation or evidence of reduced incident resolution time. Recovery belonged to the independent experiment runner, not to a remediation capability in Resolve. The earlier NetworkPolicy case also required a watchdog repair; it is not a clean safety qualification.
The most useful next context would be deployment-matched code, architecture and dependency information, recent changes, and service or business constraints. Each could answer a question the packet capture cannot. Those inputs would need their own source, version and freshness information. More context would help a reviewer assess an explanation; it would not, by itself, grant the model more authority to change the environment.
The unresolved path: a useful observation does not reveal the whole system. Conceptual illustration of missing context, not a diagram of the laboratory topology.
What I would carry into the next experiment
The practical lessons are straightforward. Separate a proposed check from permission to execute it. Keep complete captured evidence alongside the bounded view supplied to the model. Count the observations yourself. Preserve model mistakes so someone can challenge them. Make the handover identify both the useful finding and the next missing observation.
For me, the value of Resolve is whether an experienced operator can reach a better-informed next decision with less collection work. This demonstration shows parts of that workflow. Establishing its value on unfamiliar incidents will need further evaluation. The next question is whether richer, versioned context helps the model ask better questions without hiding what it still does not know.
I owned the problem, architecture, design decisions and acceptance criteria. OpenAI Codex assisted implementation, testing, documentation and packaging. NVIDIA Nemotron produced the diagnostic outputs through Nebius Token Factory. The narration is mine; no cloned or synthetic voice is used. OpenAI image generation produced the conceptual illustrations, separate from the actual product screenshots. Rootweaver existed before the competition; Resolve’s application and experiments were developed during it, with those older dependencies disclosed.
Glossary and primary references
- EndpointSlice
- A Kubernetes resource describing backend network endpoints and conditions. Kubernetes documentation.
- PCAP / pcapng
- A retained packet-capture file. This investigation uses a pcapng file that can be read offline. TShark manual.
- Hypothesis
- A possible explanation that can be strengthened or weakened by observations. Here, it remains distinct from an independently supported narrow mechanism. Resolve's scope and limitations.
- Evidence window
- The interval an observation covers. Two useful records may cover different requests and cannot automatically be paired. Recorded acquisition times.
- Retained replay
- A view of previous collection and inference. Moving through it does not execute new debugging commands. Resolve README.